
Home · Charts · Time Control
|
|
Home · Charts · Time Control |
|
This chapter of the Performance Co-Pilot tutorial provides guidance on how to interpret and understand the various measures of system-level processor (CPU) performance.
All modern operating systems collect processor resource utilization at both the process-level and the system-level. This tutorial relates specifically to the system-level metrics.
How the system-level CPU time is computed |
Utilities like mpstat, sar and Performance Co-Pilot (PCP) use a common collection of system-level CPU performance instrumentation from the kernel. This instrumentation is based upon statistical sampling of the state of each CPU in the kernel's software clock interrupt routine which is commonly called 100 times (PCP metric kernel.all.hz) per second on every CPU.
At each observation a CPU is attributed a quantum of 10 milliseconds of elapsed time to one of several counters based on the current state of the code executing on that CPU.
This sort of statistical sampling is subject to some anomalies, particularly when activity is strongly correlated with the clock interrupts, however the distribution of observations over several seconds or minutes is often an accurate reflection of the true distribution of CPU time. The kernel profiling mechanisms offer higher resolution should that be required, however that is beyond the scope of this document.
The CPU state is determined by considering what the CPU was doing just before the clock interrupt, as follows:
These states are mutually exclusive and complete, so exactly one state is assigned for each CPU at each clock interrupt.
The kernel agent for PCP exports the following metrics:
| PCP Metric | Semantics |
|---|---|
| kernel.all.cpu.user | Time counted when in user state. |
| kernel.all.cpu.nice | Time counted when in nice state. (Linux / UNIX) |
| kernel.all.cpu.sys | Time counted when in kernel state. |
| kernel.all.cpu.intr | Time counted when in irq state. |
| kernel.all.cpu.steal | Time counted when in steal state. (Linux only) |
| kernel.all.cpu.wait.total | Time counted when in wait state. (Linux / UNIX) |
| kernel.all.cpu.idle | Time counted when in idle state. |
These metrics are all "counters", in units of milliseconds (cumulative since system boot time). When displayed with most PCP tools they are "rate converted" (sampled periodically and the differences between consecutive values converted to time utilization in units of milliseconds-per-second over the sample interval). Since the raw values are aggregated across all CPUs, the time utilization for any of the metrics above is in the range 0 to N*1000 for an N CPU system; for some PCP tools this is reported as a percentage in the range 0 to N*100 percent.
$ pmchart -c CPU 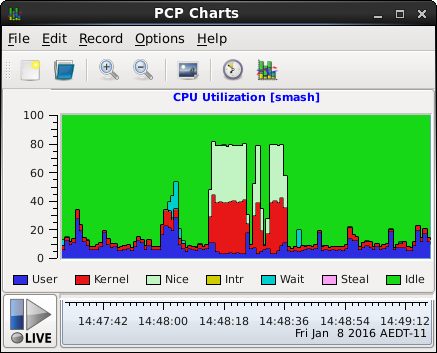
|
Interrupts |
On Linux, the irq state is further subdivided into components describing different stages of kernel interrupt handling:
The Linux kernel agent for PCP exports the following CPU interrupt metrics, the sum of which approximately equals kernel.all.cpu.intr:
| PCP Metric | Semantics |
|---|---|
| kernel.all.cpu.irq.soft | Time counted in softirq state. |
| kernel.all.cpu.irq.hard | Time counted in hardirq state. |
Virtualization |
On Linux, several additions to the processor utilization metrics from other platforms have been made, allowing finer-grained observation of the effects of virtualization.
In a virtual environment processor cycles are shared amongst virtual guests on a physical host. If a guest displays a high steal time, then cycles are being taken from that guest to serve other purposes. This indicates one of two possible things:
As described earlier the user and nice processor states are reported inclusive of virtualization guest state. There are PCP metrics allowing these states to be observed separately.
$ pmchart -c CPU -c vCPU 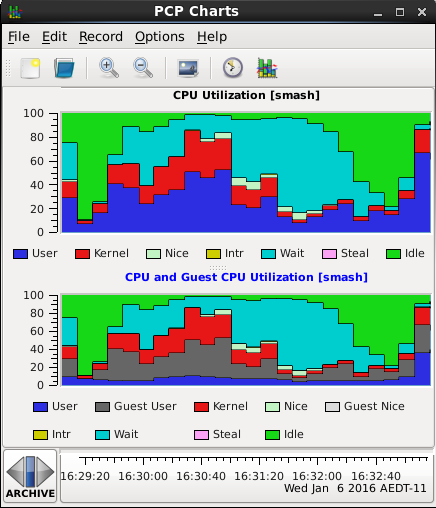
|
| kernel.all.cpu.vuser | User time when not running a virtual guest, default scheduling priority. |
| kernel.all.cpu.guest | User time when running a guest, default scheduling priority. |
| kernel.all.cpu.vnice | User time when not running a virtual guest, modified scheduling priority. |
| kernel.all.cpu.guest_nice | User time when running a guest, modified scheduling priority. |
The per-CPU variants |
Inside the kernel, most of the metrics described above are actually accumulated per-CPU for reasons of efficiency (to reduce the locking overheads and minimize dirty cache-line traffic).
PCP exports the per-CPU versions of the system-wide metrics with metric names formed by replacing all by percpu, e.g. kernel.percpu.cpu.user.
Note that on some multiprocessor UNIX platforms with one I/O pending, all otherwise idle CPUs will be assigned the wait state. This may lead to an over-estimate of the I/O wait time, as discussed in the companion How to understand measures of disk performance document. This is not the case on Linux, however, where pre-CPU request queues track counts of processes in I/O wait state.
The pcp-atop and pcp-atopsar tools can be used to report the per-CPU utilization metrics, the latter in a fashion similar to the mpstat -I CPU option.
Reconciling mpstat, sar -u and PCP CPU performance metrics |
The mpstat and sar metrics are scaled based on the number of CPUs and expressed in percentages, PCP metrics are in units of milliseconds per second after rate conversion; this explains the PCP metric hinv.ncpu and the constants 100 and 1000 in the expressions below.
When run without options, sar reports the following:
| sar metric |
PCP equivalent (assuming rate conversion) |
|---|---|
| %user | 100 * kernel.all.cpu.user / (hinv.ncpu * 1000) |
| %nice | 100 * kernel.all.cpu.nice / (hinv.ncpu * 1000) |
| %system | 100 * (kernel.all.cpu.sys + kernel.all.cpu.intr) / (hinv.ncpu * 1000) |
| %iowait | 100 * kernel.all.cpu.wait.total / (hinv.ncpu * 1000) |
| %steal | 100 * kernel.all.cpu.steal / (hinv.ncpu * 1000) |
| %idle | 100 * kernel.all.cpu.idle / (hinv.ncpu * 1000) |
On the other hand, mpstat, and sar with the -u ALL option, report the following:
| mpstat metric |
PCP equivalent (assuming rate conversion) |
|---|---|
| %usr | 100 * kernel.all.cpu.vuser / (hinv.ncpu * 1000) |
| %nice | 100 * kernel.all.cpu.vnice / (hinv.ncpu * 1000) |
| %sys | 100 * kernel.all.cpu.sys / (hinv.ncpu * 1000) |
| %iowait | 100 * kernel.all.cpu.wait.total / (hinv.ncpu * 1000) |
| %steal | 100 * kernel.all.cpu.steal / (hinv.ncpu * 1000) |
| %irq | 100 * kernel.all.cpu.irq.hard / (hinv.ncpu * 1000) |
| %soft | 100 * kernel.all.cpu.irq.soft / (hinv.ncpu * 1000) |
| %guest | 100 * kernel.all.cpu.guest / (hinv.ncpu * 1000) |
| %gnice | 100 * kernel.all.cpu.guest_nice / (hinv.ncpu * 1000) |
| %idle | 100 * kernel.all.cpu.idle / (hinv.ncpu * 1000) |
The load average |
The "load average" is reported by pcp-uptime, pcp-atop, etc. and the PCP metric kernel.all.load.
$ source /etc/pcp.conf $ tar xzf $PCP_DEMOS_DIR/tutorials/cpuperf.tgz $ pcp --origin 'Tuesday 4:30pm' --archive cpuperf/system -z uptime 16:30:07 up 5:15, 11 users, load average: 1.59, 1.54, 1.23 |
The load average is an indirect measure of the demand for CPU resources. It is calculated using the previous load average (load) the sum of the currently runnable processes (nr_active), and an exponential dampening expression, e.g. for the "1 minute" average, the expression is:
load = exp(-5/60) * load + (1 - exp(-5/60)) * nr_active
The three load averages use different exponential constants and are all re-computed every 5 seconds.
On Linux, nr_active is computed as the sum across all processors (i.e. using per-CPU counters) of the number of running tasks and the number of uninterruptible tasks.
Note that the "run queue length" (reported by the -q option of sar) uses the aggregation across all processors of the number of running tasks only (does not include uninterruptible tasks). This is the kernel.all.runnable PCP metric.
Copyright © 2007-2010 Aconex |