FAQ
General Questions
- What is Performance Co-Pilot?
- What is the overall PCP architecture?
- What licensing scheme does PCP use?
- How is PCP different from tools like vmstat, ps, top, etc.?
- Metrics, names, instances and values, ... eh?
- Where is Performance Metrics Application Programming Interface (PMAPI) documented?
- Which application development languages are supported?
- Are there any sample screenshots of tools in action?
- Are there any papers or presentations about PCP?
Philosophical Questions
Technical Questions
- What is the nature of the communication between processes?
- What is involved in fetching metrics from PMCD?
- Data aggregation and averaging in a PMDA?
- Can a monitor ask for qualitative events (e.g. threshold passing), instead of regular samples?
- How are triggers and alarms integrated to provide external notification?
- Synchronous versus asynchronous notification?
- Do you try to synchronize clocks?
- Is there an optimized mechanism for local monitoring?
- What about security?
Answers
What is Performance Co-Pilot?
Performance Co-Pilot (PCP) is a framework and services to support system-level performance monitoring and performance management.
The architecture and services are most attractive for those seeking centralized monitoring of distributed processing (e.g. in a cluster or webserver farm environment), or on large systems with lots of moving parts. However some of the features of PCP are also useful for hard performance problems on smaller system configurations.
More details are avaliable on the main project page .
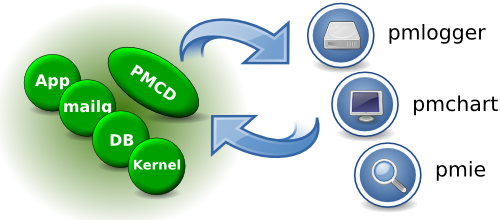
What is the overall PCP Architecture?
As shown below, performance data is exported from a host by the PMCD (Performance Metrics Co-ordinating Daemon). PMCD sits between monitoring clients and PMDAs (Performance Metric Domain Agents). The PMDAs know how to collect performance data. PMCD knows how to multiplex messages between the monitoring clients and the PMDAs.
What licensing scheme does PCP use?
All of the libraries in the Performance Co-Pilot (PCP) toolkit are licensed under Version 2.1 of the GNU Lesser General Public License
All other PCP components are licensed under Version 2 or later of the GNU General Public License
How is PCP different from tools like vmstat, ps, top, etc?
Each of these standard tools:
- collects a predefined mix of metrics
- understands the syntax and semantics of the various "stat" files below /proc
- involves no IPC or context switches associated with synchronous IPC
- only monitors the local host and cannot monitor a remote host
- cannot replay historical data
Each of these standard tools could also be re-implemented over the PCP protocols, in which case they would each:
- collect a predefined mix of metrics
- be insulated from how the data is extracted, and have access to the explicit data semantics over the PCP APIs
- optionally (and typically) involve IPC and context switches associated with synchronous IPC
- monitor the local host or a remote host with equal ease and no application program changes
- process real-time or historical data with equal ease and no application program changes
As examples, pmstat is a re-implementation of vmstat using the PCP APIs, and similarly pcp-atop, pcp-atopsar, pcp-dstat, pcp-free, pcp-htop, pcp-numastat, pcp-uptime, and so on are all PCP versions of the original tools.
Other new PCP clients can always be written to embrace and extend functionality from existing tools, e.g.
- monitor multiple hosts concurrently, e.g. think of top or vmstat working across all nodes in a cluster; in fact pmstat can monitor an arbitrary number of hosts concurrently
- be more general and support display, plotting, visualization for arbitrary collections of performance metrics, including those from the service, library and application layers that are outside any procfs or other system call export mechanism discover and exploit extensible collections of performance metrics as you develop new agents or "plugins"
Metrics, names, instances and values, ... eh?
Performance Co-Pilot uses a single, comprehensive, data model to describe all available performance data.
- Metric
- Information about some activity or resource utilization or quality of service or tuning parameter or configuration.
- Metric Value(s)
- Each metric may have one value (e.g. the number of CPUs in the system), or a set of values (e.g. the number of system calls for each CPU in the system). The former are called singular metrics, the latter have an associated instance domain to describe the set for which values exist.
- Metric Names
- Each metric has an associated name. The names are maintained as a hierarchy in a Performance Metrics Name Space (PMNS) and a "dot" notation is used to describe a path through the PMNS. Metrics are associated with leaf nodes in the PMNS. For example: hinv.ncpu, kernel.percpu.syscall, kernel.percpu.cpu.sys and kernel.all.load.
- Metric Descriptors
-
Each metric has an associated descriptor that provides
information that may be used to decode and interpret
the values of the metric over time. The descriptor
provides the following information:
- A unique internal Performance Metric Identifier (PMID)
- The data type for the value(s), being one of 32, U32, 64, U64, FLOAT, DOUBLE, STRING, AGGREGATE.
- The identifier for the associated instance domain for set-valued metrics, else PM_INDOM_NULL for singular metrics.
- The semantics of the value(s), i.e. counter, instantaneous, discrete.
- The units of the value(s), expressed as a dimension and scale in the axes time, space and events.
- Instance Domain
-
When a metric has a set of associated values, each
value belongs to an instance of an instance domain.
For example the metric kernel.percpu.syscall has one
value for each CPU (or instance) and the instance
domain describes how many CPUs there are and how they
are distinguished from one anoter (i.e. their names).
Each instance domain is described by the following
information:
- A unique internal instance domain number (used in the metric descriptors to associate one or more metrics with each instance domain).
- A list of unique external names for each instance.
- A list of unique internal identifiers for each instance (the protocols prefer to move 32-bit instance numbers rather than ASCII instance names).
Putting this altogether we can use pminfo to explore the available information.
$ pminfo filesys
filesys.capacity
filesys.used
filesys.free
filesys.maxfiles
filesys.usedfiles
filesys.freefiles
filesys.mountdir
filesys.full

$ pminfo -md filesys.free
filesys.free PMID: 60.5.3
  Data Type: 64-bit unsigned int  InDom: 60.5 0xf000005
  Semantics: instant  Units: Kbyte

$ pminfo -f filesys.free
filesys.free
  inst [0 or "/dev/root"] value 3498272
  inst [1 or "/dev/hda3"] value 20106
  inst [2 or "/dev/hda5"] value 7747420
  inst [3 or "/dev/hda2"] value 368432
Where is the Performance Metrics Application Programming Interface (PMAPI) documented?
The PMAPI defines the interface between a client application requesting performance data and the collection infrastructure that delivers the performance data.
There are "man" pages for every routine defined at the PMAPI. Start with "man 3 pmapi" for an overview. See also Chapter 3 of the: Performance Co-Pilot Programmer's Guide
Which application development languages are supported?
Most agents and clients are written in C. Some clients are C++, and others are written in Python. There are several Perl and Python agents, but C remains the most common at this stage. Application instrumentation is supported using the PCP MMV (memory-mapped-value) API. This is a C library with Perl and Python bindings. A pure-Java implementation exists as well - refer to the separate "Parfait" project.
Are there any sample screenshots of tools in action?
Why yes, yes there are - in addition to the examples in the books about PCP, you might also enjoy this local collection and some from the more recent Grafana PCP plugin. .
Are there any papers or presentations about PCP?
Indeed - a reference list of all those we have permission to reproduce can be found here .
Why the name "Co-Pilot"?
PCP was designed to assist in reducing difficult performance problems into something that can be managed by a human. In the same way that modern aircraft have tightly integrated computer control systems that a pilot cannot fly without, PCP assists in managing and understanding otherwise impossibly complex performance scenarios.
Why the name "Glider"?
PCP Glider contains the native Windows version of PCP. The rationale for the name is along these lines:
- It's not "just" PCP, so its not just called "Windows PCP". It includes a relatively complete, cross-platform performance management environment for Windows - PCP and PCP GUI are components, but there are many other pieces (including C compiler, and Qt4 runtime)
- "Glider" continues the "Co-Pilot" aeronautical theme, and is meant to represent "making something difficult appear effortless".
What is the nature of the communication between processes?
The TCP/IP communication between PMCD and a monitoring client is connection-oriented for the most part.
The when a connection is lost, the client library will automatically attempt reconnection to the PMCD with a controlled maximal rate of trying (uses a variant of exponential back-off). The error-handling regime for the clients already supports "no data currently available" for lots of reasons (like a PMDA is not installed or PMCD was restarted or lost the connection to PMCD), so there is typically very little that the client developer needs to do to handle this gracefully.
For monitor clients, once the initial metadata exchanges with PMCD are complete, there is typically one message to PMCD and one message back from PMCD for each sample, independent of the number of metrics requested and the number of instances (or values) to be returned.
pmlogger is a monitor client, so the same applies to communication between PMCD and pmlogger
At PMCD, each message from a monitor client is forwarded to one or more PMDAs, PMCD then collates the messages back from each PMDA that was asked to help and returns a single message to the client. It is an important part of the design that:
- clients are ignorant of the de-multiplexing and multiplexing by PMCD
- PMDAs are ignorant of each other
- PMCD knows nothing, except how to act as a message switcher
The communication between PMCD and the PMDAs uses TCP/IP or pipes or direct procedure calls (for DSO PMDAs).
What is involved in fetching metrics from PMCD?
The following high-level description follows the interactions between a monitoring client and PMCD to fetch metrics periodically.
- The monitoring client connects to PMCD and explores the Performance Metrics Name Space using pmGetChildren(3) or pmTraversePMNS(3) for either one-level at a time expansion or recursive expansion.
- Once the client has the name(s) of the metrics of interest, pmLookupName(3) returns PMIDs and then pmLookupDesc(3) will return the descriptor for a metric.
- For set-valued metrics, use the instance domain number from the metric descriptor, and the routines pmLookupInDom(3) pmGetInDom(3) and pmNameInDom(3) to browse the instance domain. Alternatively, ignore the instance domain and all instances will be returned.
- See also pmLookupText(3) and pmLookupIndomText(3) for help text about metrics and instances (better suited for human consumption than interpretation by monitoring clients).
- Repeat until bored: pmFetch(3) ; report; sleep;
To see all of the gory details, turn on PDU tracing and run simple pminfo commands:
$ pminfo -D PDU kernel.all.cpu
$ pminfo -D PDU -fdT kernel.all.load
See also Metrics, names, instances and values, ... eh?
Data aggregation and averaging in a PMDA?
Mark D. Anderson asks: obviously a monitor can compute anything it likes, but can a monitor request that a agent do some server-side computation before sending the resulting data back, either across measurements (say, changing units or adding together), or across time (running average, etc.)?
This is certainly possible, but we've tended to discourage it. Philosophically we believe any interval-based aggregation belongs in the monitoring clients. The PMDA cannot see the client state, so the PMDA does not know which client it is responding to at the moment, so you'd need to add some additional state using the pmStore(3) interface to selectively modify state in the PMDA from a client (this is typically used to toggle debug flags or enable optional instrumentation and changing units would be in this category).
Can a monitor ask for qualitative events (e.g. threshold passing), instead of regular samples?
Not directly. Use the Performance Metrics API (PMAPI) directly for periodic sampling (most of the PCP monitoring tools are like this). Use pmie for filtering and events. See also Synchronous versus asynchronous notification .
How are triggers and alarms integrated to provide external notification?
External notification usually means some combination of e-mail, paging, phone-home or posting to an event clearinghouse.
pmie is the PCP tool for automated monitoring and taking predicated actions. pmie's actions are arbitrary; there are some canned ones, but then there is a general "execute this command" action. The latter has been used to do pager events, and integrate events into larger system management frameworks like Nagios, OpenView, and so on.
Synchronous versus asynchronous notification?
The model for shipping values of the performance metrics from PMCD to the monitoring clients is "synchronous pull" where the clients explicitly ask for data when they want it. There is no push, broadcast, callback or other asynchronous notification for the values of performance metrics, although pmie can be used to perform period sampling and raise asynchronous alarms (of any flavour) when something interesting happens.
For more details refer to the Performance Co-Pilot Programmer's Guide
Do you try to synchronize clocks?
No. The clients receive one timestamp from PMCD with each group of values returned, so the only issue is skew when a monitoring client is processing performance data from more than one host or more than one archive.
This is not a real problem in most cases because PCP is aiming at system-level performance monitoring, with a bias for large systems, so sampling rates are typically of the order of a few seconds up to tens of minutes. We do not try to tackle event traces requiring sub-microsecond accuracy in the timestamps.
Is there an optimized mechanism for local monitoring?
Yes. Applications wishing to avoid the overhead of connection to PMCD and communication over TCP/IP may extract operating system performance data directly using the DSO implementation of the PMDA. The same application can decide at run-time to use either the regular or the express access path.
See PM_CONTEXT_LOCAL in pmNewContext(3).
What about security?
Originally, there was no client or server authentication and no encryption. In recent releases, this has been extended with optional secure connections, which are encrypted and can also provide user authentication.
A simple access control model was used in the past - the PMCD daemon and the pmlogger processes support an IP-based allow/disallow mechanism for client connections on some or all network interfaces.
This too has since been extended, allowing for a user based access control mechanism such that access to the collector daemons can be restricted based on host(s), user(s) and/or group(s).
PMNS appears to be empty!
If you re-build PCP from the source and use "make install" to do the installation (as opposed to a package-based installation), some manual post-installation steps will be required.
In particular the "PMNS appears to be empty!" message from any PCP monitoring tool means the Performance Metrics Name Space (PMNS) has not been correctly set up. To fix this:
# source /etc/pcp.conf
# touch $PCP_VAR_DIR/pmns/.NeedRebuild
# $PCP_RC_DIR/pcp start
else if you are not starting pmcd this way, the brute-force method is,
# cd $PCP_VAR_DIR/pmns
# ./Rebuild -du
Resource utilization greater than 100%?
Mail received from Nicholas Guillier on Wed, 30 Jun 2004.
I use PCP-2.2.2 to remotely monitor a Linux system.
I sometimes face a strange problem: between two
samples, the consumed CPU time is higher than the
real time! Once turned into a percentage, the resulting
value can reach up to 250% of CPU load! This case occurs
for kernel.cpu.* metrics and with disk.all.avactive
metric as well (both from the Linux pmda).
First CPU time and disk active time are both really counters in units of time in the kernel, so the reported value for the metric v requires observations at times t 1 and t 2 then reporting the rate (actually time/time, so a utilization) as (v(t 2 ) - v(t 1 )) / (t 2 - t 1 )
The sort of perturbation you report occurs when the collector system (PMCD and PMDAs) is heavily loaded.
The collection architecture assigns one timestamp per fetch, and if the collection system is heavily loaded then there is some (non-trivial in the extreme case) time window between when the first value in the fetch is retrieved from the kernel and when the last is retried from the kernel.
Let me try to explain with an example with two counter metrics, x and y with correct values as shown below:
| Time (t) | x | y |
|---|---|---|
| 0 | 0 | 0 |
| 1 | 1 | 10 |
| 2 | 2 | 20 |
| 3 | 3 | 30 |
| 4 | 4 | 40 |
| 5 | 5 | 50 |
| 6 | 6 | 60 |
| 7 | 7 | 70 |
| 8 | 8 | 80 |
Now on a lightly loaded system, if we consider 3 samples at t=1, t=4 and t=7, and [x] is the timestamp associated with the returned values:
| Time | Action |
|---|---|
| 1 |
pmcd retrieves x=1 and y=10
pcp client receives {[1] x=1 y=10} |
| 4 |
pmcd retrieves x=4 and y=40
pcp client receives {[4] x=4 y=40} |
| 7 |
pmcd retrieves x=7 and y=70
pcp client receives {[7] x=7 y=70} |
And the reported rates would be correct, namely:
| Time (t) | x | y |
|---|---|---|
| 1 | no values available | no values available |
| 4 | (4-1)/3=1.00 | (40-10)/3=10.00 |
| 7 | (7-4)/3=1.00 | (70-40)/3=10.00 |
Now on a heavily loaded system this could happen ...
| Time | Action |
|---|---|
| 1 |
pmcd retrieves x=1 and y=10
pcp client receives {[1] x=1 y=10} |
| 4 |
pmcd retrieves x=4
..delay.. |
| 5 |
pmcd retrieves y=50
pcp client receives {[5]x=4 y=50} |
| 7 |
pmcd retrieves x=7 and y=70
pcp client receives {[7] x=7 y=70} |
And the reported rates would be ...
| Time (t) | x | y |
|---|---|---|
| 1 | no values available | no values available |
| 4 | (4-1)/4=0.75 | (50-10)/4=10.00 |
| 7 | (7-4)/2=1.50 | (70-50)/2=10.00 |
So, the delayed fetch at time 4 (which does not return values until time 5) produces:
- x is too small at t=5
- x is too big at t=7
You're noticing the second case.
Note that because these are counters, the effects are self-cancelling and diminish over longer sampling intervals. There is nothing inherently wrong here.
PMDA appears to have died
Sometimes errors are returned from a metric value fetch from pmcd like "No PMCD agent for domain of request".
There are a number of possible causes, but one is most common. This is the scenario where a PMDA is unable to respond to a request in a timely fashion, usually due to unexpected or unusual latency in the source of its values (the "domain") and not anything related to the PMDA at all.
Since pmcd aims to provide realtime metrics at the time of each sample, it cannot wait for long for the PMDA. So it times out the request after a short period (a few seconds by default), assuming the PMDA is unavailable when no response is received, and closes its connection to the PMDA.
This appears from the client side as if the PMDA died as no values are available. Examination of pmcd.log can be used to confirm when timeouts have occured.
As of pcp-3.11.3 there are now two strategies available to mitigate this by attempting automatic recovery. In both cases, pmdaroot must be configured and running (by default it is) for these strategies to be effective.
Firstly, pmcd will attempt one immediate restart of any PMDA it timed out, at the first available opportunity. This is quite effective, but there remain several cases where it can be thwarted. As it involves a once-only rectification attempt, a backup strategy is also useful.
Secondly, a local primary pmie daemon can be enabled to continually monitor the PMDAs and signal to pmcd when a restart is needed. If a PMDA can be restarted automatically, eventually this strategy will manage to do so (unlike the earlier single-shot strategy). pmie is not typically enabled by default, however; refer to the pmie section in the Quick Reference which describes how to enable pmie.
This latter mechanism also writes to the system log when a PMDA is detected to have failed, and the log message contains details about exactly which PMDAs were affected.