
Home · Charts · Time Control
|
|
Home · Charts · Time Control |
|
This chapter of the Performance Co-Pilot tutorial discusses the steps required to integrate PCP into the various management frameworks available. It takes into consideration the distributed nature of both the management frameworks and of the PCP tools, and how best to combine the functionality they offer.
Points of Integration |
Following is a brief description on how PCP can be integrated in terms of some of the aligned features of PCP and the typical management framework.
The PCP archiving utility pmlogger(1) generates performance data files in the PCP archive format, which is specifically designed for optimal fetch latency when retrieving data from the archive for replay and when seeking to random time points in the archive. This format is specific to the PCP tools and the PMAPI, and clearly external interfaces are necessary for non-PCP tools to read the data.
The LOGIMPORT(3) APIs provide a mechanism for importing data into a PCP archive. Using these services, tools are provided to import common sources of performance data such as spreadsheets, binary data from sar(1) and iostat(1) output. Other tools can easily be developed in C or Perl, see LOGIMPORT(3), pmiStart(3) and PCP::LogImport(3).
There are a number of PCP tools which have specifically been developed with the aim of producing a format which is easily incorporated into an external framework, database, or spreadsheet application - for example, the pmdumptext(1) and pmlogsummary(1) tools both provide options to output data in a time-stamped, tab-delimited or comma-separated form, which is easily incorporated into other tools. PCP also provides daily log rotation, merging and culling facilities for multiple collector hosts from a single monitor host, as well as the automated pmchart/cron/pmsnap performance graph image generation facility.
Due to the unlimited potential consumers of this historical performance data, it is left as an exercise for the reader to figure out how best to incorporate this data into their own environment.
Note that all of the PCP tools are "timezone-aware" and can switch between the timezone of the monitoring machine and the timezone of the collector machine for which the archive was generated (this information is stored in the archive). Also, PCP archives can be generated on a machine of one operating system version, architecture or byte-order, and replayed on a completely different machine.
Among the more compelling reasons for making use of a management framework to administer an enterprise are the distributed monitoring and centralized analysis aspects. All frameworks provide event monitoring facilities, of varying complexity. Some provide simple point to point event generation, others have proxy event servers which allow events to be filtered and then potentially passed upstream to another event monitor. To allow the framework to be extended, the frameworks will typically provide a mechanism for external applications to push their own events into the framework, and it is this feature which we wish to exploit in our PCP integration efforts.
Although PCP does provide a powerful inference engine in pmie(1) (as well as a far richer set of performance metrics than the more generic frameworks can provide, and low latency protocols designed specifically for transporting performance data quickly), no attempt is made to provide an event "sink" - some application which will display and filter performance events for the user. From an enterprise management point of view, an event monitoring facility specifically for performance events would be exactly the wrong thing to do from within PCP - system administrators managing a wide array of different machines should expect to see all system-wide events coming to a single point for their notification.
So, the integration point must be from pmie(1) - when it detects an abnormal performance situation, it must pass it on in the most appropriate manner possible. Unfortunately, the various event management frameworks have widely differing mechanisms for receiving events, so each framework must be handled separately in order to make best use of their event viewing and filtering capabilities.
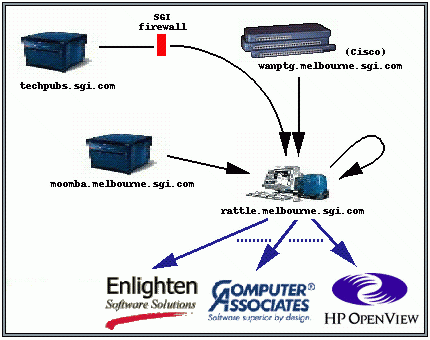
The diagram shows a typical pmie(1) setup - rattle.melbourne.sgi.com running pmie, fetching performance data from a variety of sources, then evaluating its set of performance rules and generating events into whichever event "sinks" have been specified. Specifying how to generate an event, which rules to use, how frequently to evaluate each of the rules, which hosts to monitor, etc, is performed by the pmieconf(1) utility, which can be extended to allow new frameworks to be incorporated.
A number of the enterprise management frameworks have the ability to provide closer integration between the tools themselves, for example starting PCP tools from a menu option of some of the framework's tools, or by installing additional on-line help for the performance events which PCP generates. This level of integration is not attempted, and is not seen as providing much value in practice. The pmieconf(1) utility is the definitive source of help text for the performance events generated by pmie(1) - it describes the rules and each of the customizable variables affecting the rules (including the "global" variables affecting all of the rules, such as where to send events when a performance event is generated).
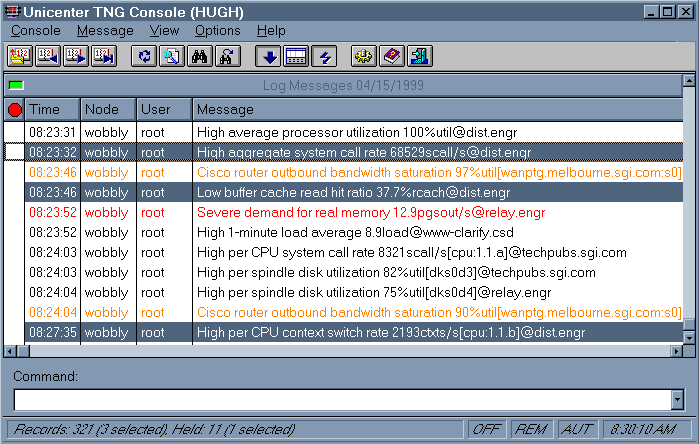
CA/Unicenter TNG (Computer Associates) |
Step-by-step - how to setup and ensure pmie(1) can talk to the Unicenter TNG Framework:
wobbly# $CAIGLBL0000/bin/unicntrl start cci
wobbly#
wobbly# $CAIGLBL0000/cci/bin/rmt status

  Sysid  State                 Last Send Time  Last Receive Time
--------|---------------------|---------------|-----------------
hugh     ACTIVE                041099 17:54:37 041199 13:42:01

wobbly#
For Windows machines:
C:\TNGFW\BIN>rmtcntrl status
SUCCESS: information returned
Sysid    State                 Last Send Time  Last Receive time
--------|---------------------|---------------|-----------------
HUGH     ACTIVE
WOBBLY   ACTIVE                Apr-10-99 17:58:25 Apr-10-99 17:58:25

C:\TNGFW\BIN>
wobbly# $CAIGLBL0000/bin/cawto -n hugh -g Performance -s wobbly test event
There are several tools which ship with the TNG Framework for examining and verifying the connection between two nodes - such as oprping(1) - refer to the Unicenter TNG documentation for full details.
wobbly# pmieconf modify global tngfw_action yes
wobbly# $PCP_RC_DIR/pmie start
wobbly# pmieconf modify global tngfw_node hugh
wobbly# $PCP_RC_DIR/pmie start
wobbly# pmieconf modify global tngfw_color Yellow
wobbly# pmieconf modify global tngfw_category "PMIE Events"
wobbly# pmieconf modify cisco tngfw_color Red
wobbly# $PCP_RC_DIR/pmie start
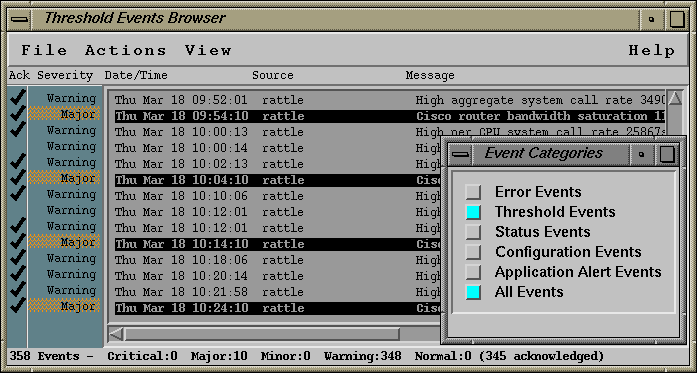
HP OpenView (Hewlett-Packard) |
Step-by-step on how to setup and ensure pmie(1) can talk to OpenView:
wobbly# service snmp start
wobbly# service ovnnm start
rattle# cd $OV_BIN
rattle# ./ovevent -c "Status Events" -s Normal \
.1.3.6.1.4.1.11.2.17.1.0.58916872 \
.1.3.6.1.4.1.11.2.17.2.1.0 Integer 14 \
.1.3.6.1.4.1.11.2.17.2.2.0 OctetString "rattle" \
.1.3.6.1.4.1.11.2.17.2.4.0 OctetString "test event"
wobbly# cd $OV_BIN
wobbly# ./xnmevents &
rattle# pmieconf modify global ov_action yes
rattle# $PCP_RC_DIR/pmie start
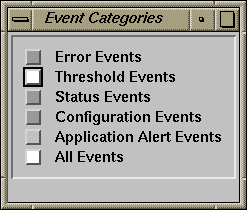
The viewer lets you view, filter, and acknowledge events (once all events are acknowledged, the "Threshold Events" button becomes white - until the next event arrives).
Configuration options - using pmieconf(1) to customize the setup for different environments:# pmieconf modify global ov_node wobbly # $PCP_RC_DIR/pmie start
rattle# pmieconf modify filesys.filling ov_severity Critical
rattle# pmieconf modify filesys.filling ov_category "Status Events"
rattle# pmieconf modify cisco ov_severity Major
rattle# $PCP_RC_DIR/pmie start
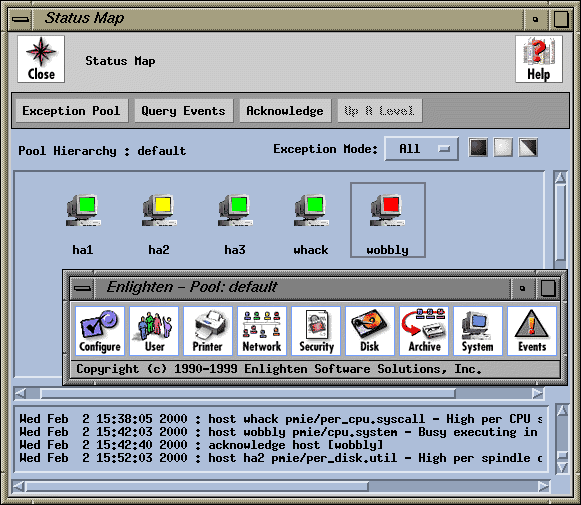
EnlightenDSM (Enlighten Software Solutions) |
Step-by-step on how to setup and ensure pmie(1) can talk to EnlightenDSM:
wobbly# /opt/enlighten/bin/start_enl_daemons -r
...
start_emdd: Invoking /opt/emd/bin/emdd...
start_enl_daemons: Invoking /opt/enlighten/bin/pep...
start_enl_daemons: Invoking /opt/enlighten/bin/renld...
start_enl_daemons: Invoking /opt/enlighten/bin/AgentMon...
wobbly# /opt/enlighten/bin/xenln &
wobbly# /opt/enlighten/bin/EventsCli -n Test -u tps -v 12345 -s 5 -q
wobbly# pmieconf modify global enln_action yes
wobbly# $PCP_RC_DIR/pmie start
The only configurable option of note for Enlighten DSM is the ability to change the severity setting for individual events, event groups, or globally for all events (where severity is a number between a low of 1 and a high of 5, and the default severity value for pmie(1) events is 2):
wobbly# pmieconf modify filesys.filling enln_severity 4
wobbly# pmieconf modify cisco enln_severity 5
wobbly# $PCP_RC_DIR/pmie start
Extending to Other Frameworks |
All of the enterprise management frameworks we've come across provide some mechanism for generating events from outside the framework. This is usually in the form of a stand-alone utility, but could also be an API, which packages the attributes associated with an event (these attributes are usually things like severity, source host, message text, etc) and sends this to the monitoring host.
Since pmie(1) supports running an arbitrary command upon detection of a performance event (in addition to its other native actions, such as writing an entry in the system log file), this is the hook we'll use to add support for additional frameworks.
Steps involved when integrating other frameworks with PCP:
# pmieconf -r newfile list global
	# pmieconf modify global new_action yes
	# $PCP_RC_DIR/pmie start
Copyright © 2007-2010 Aconex |