Features
Collect

Kernel agents for each supported platform. The Linux agent exports a broad range of performance data from kernels since 2.0.36 or later. This includes coverage of activity in the areas of: CPU, disk, memory, swapping, network, NFS, RPC, filesystems, and per-process statistics.
Other agents export performance data from: Databases, Log files, Web servers, Mail systems, Cisco routers, Search engines, Cluster infrastructure, Application instrumentation (including the JVM) and the PCP infrastructure itself.
Assorted simple monitoring tools that use the PCP APIs to retrieve and display either arbitrary performance metrics, or specific groups of metrics (as in pmstat, a cluster-aware vmstat lookalike).
Analyze

A single API for accessing the performance data that hides details of where the data comes from and how it was captured and imported into the PCP framework.
Integrated archive logging and replay so a client application can use the same API to process real-time data from a host or historical data from an archive.
The framework supports APIs and configuration file formats that enable the scope of performance monitoring to be extended at all levels.
The PCP inference engine supports automated monitoring through a rule-based language and interpreter that performs user-defined actions when rule predicates are found to be true.
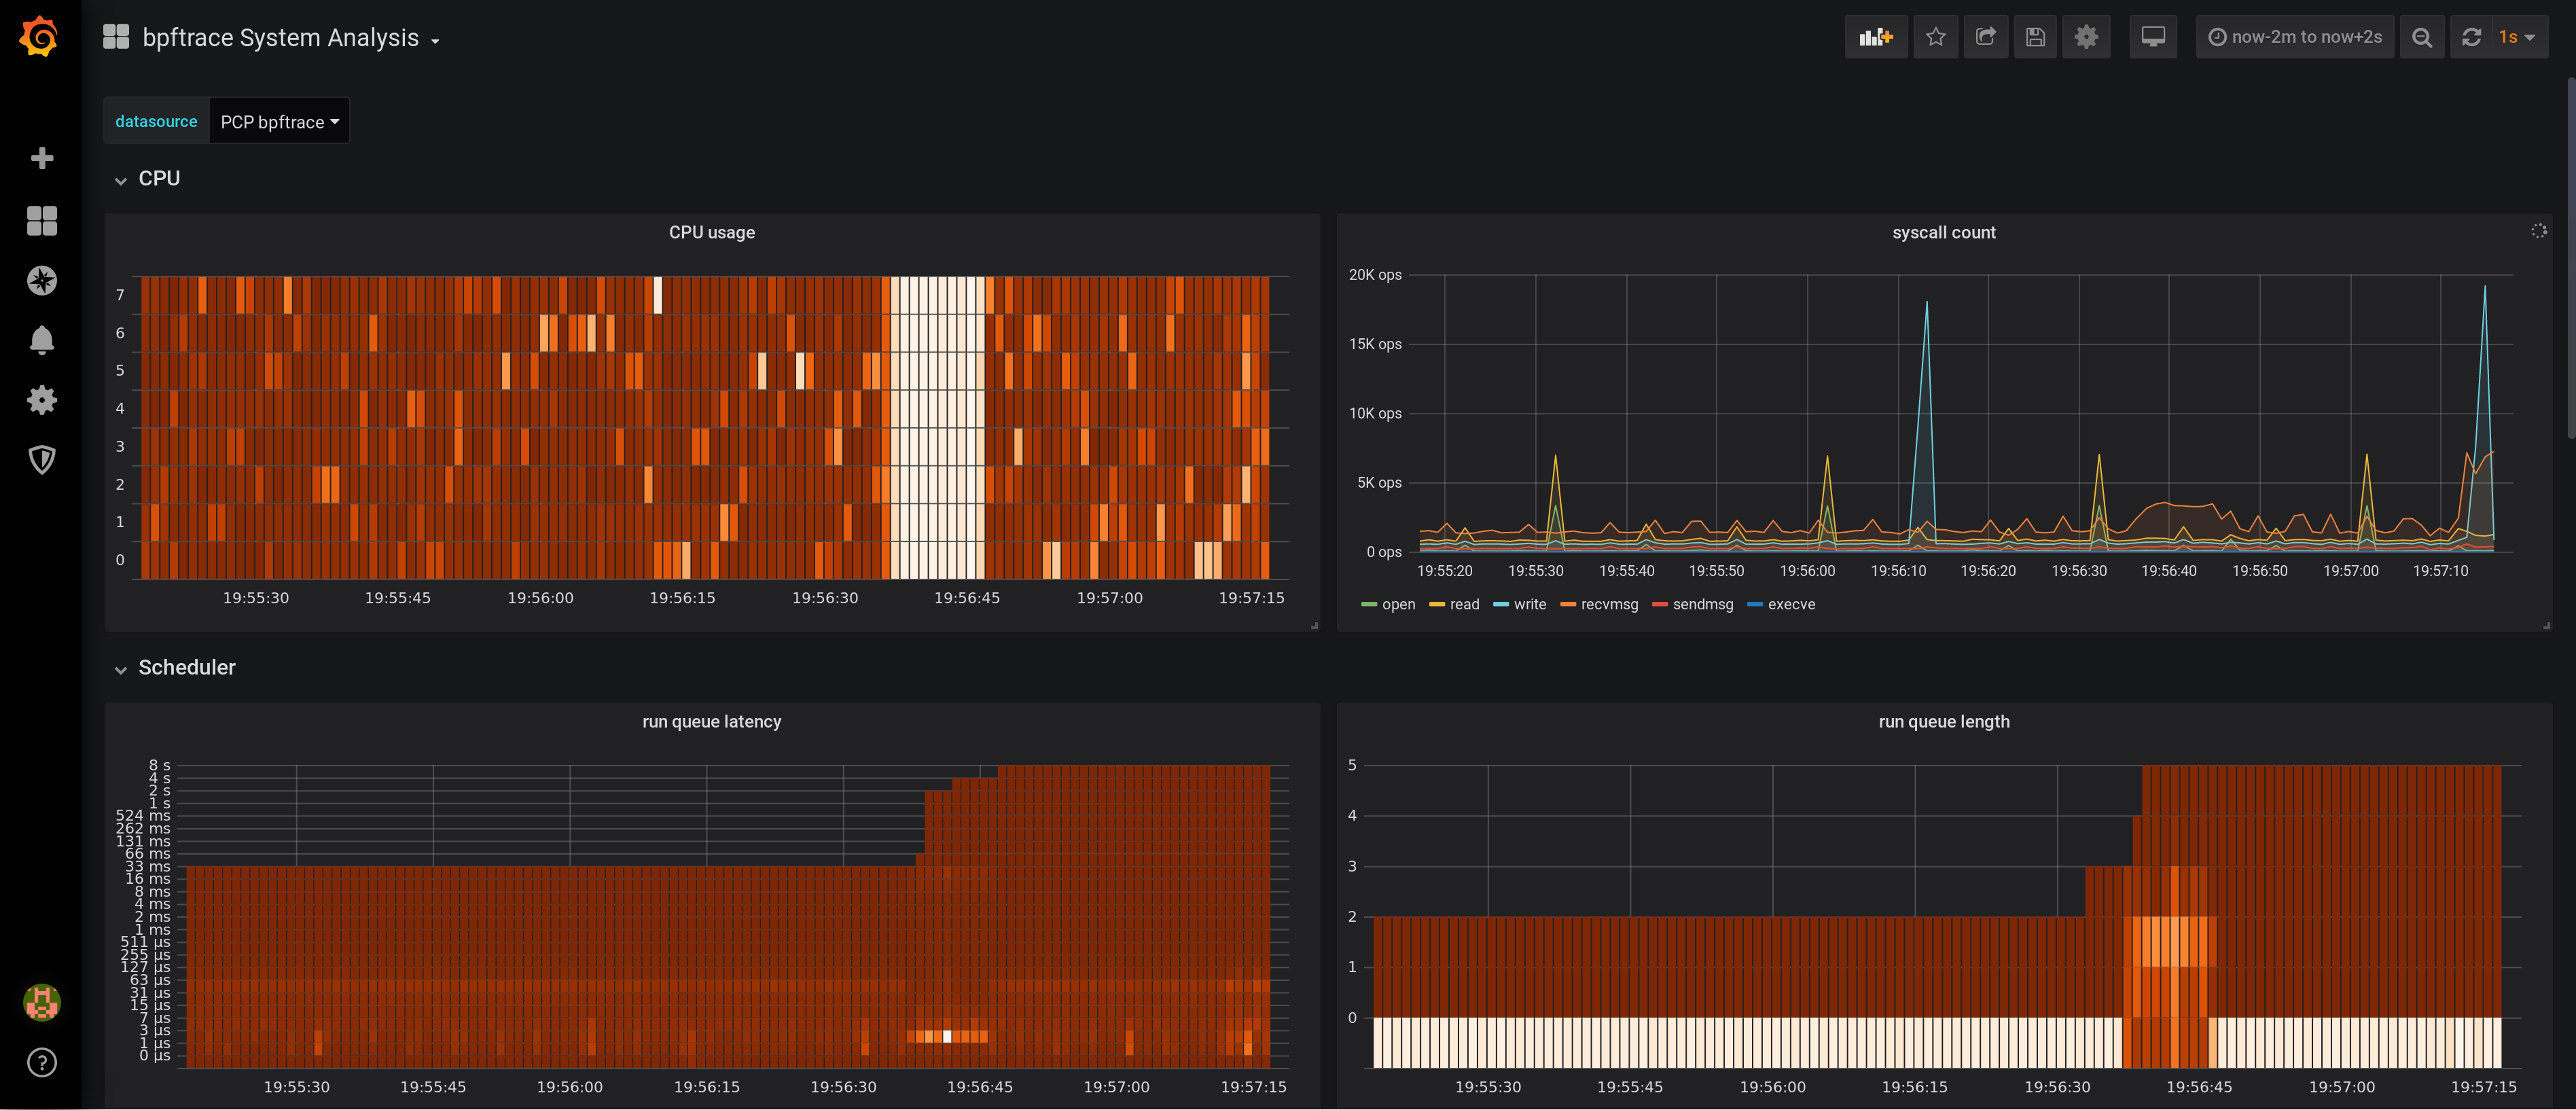
Access the graph data through a web interface or a GUI

Distributed

A client-server architecture allows multiple clients to monitor the same host, and a single client to monitor multiple hosts (e.g. in a cluster). This enables centralized monitoring of distributed processing.
An endian-safe transport layer for moving performance metrics between the collector and the monitoring applications over TCP/IP. This means a desktop with PCP can monitor remote server systems with different architectures and operating systems.
Extend

A "plugin" framework (libraries, APIs, agents and daemon) to collect performance data from multiple sources on a single host, e.g. from the hardware, the kernel, the service layers, the application libraries, and the applications themselves.
Libraries and sample implementations encourage the development of new "plugins" (or agents) to capture and export the performance data that matters in your application environment, along side the other generic performance data.